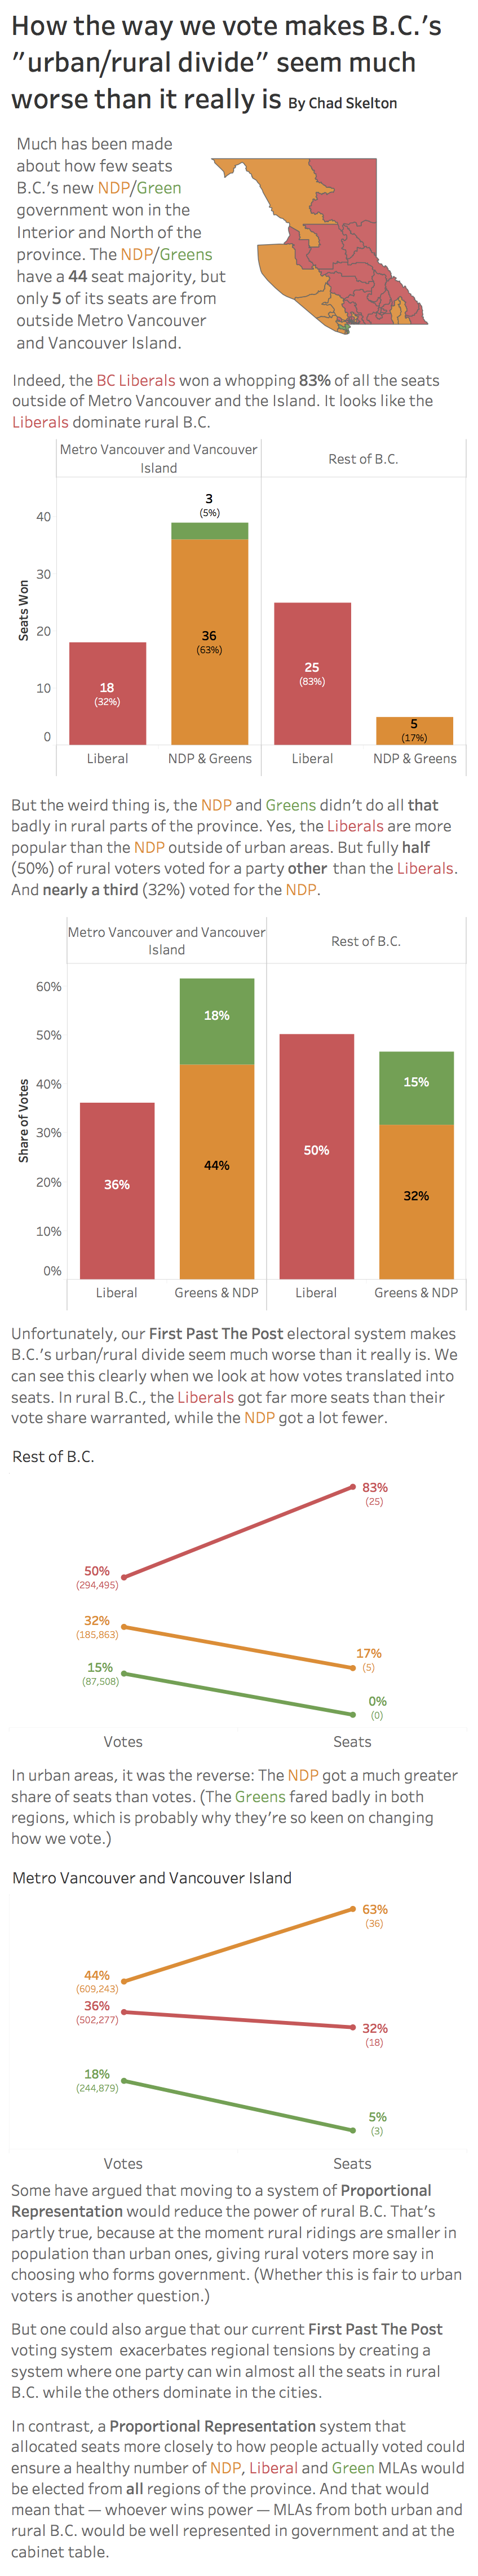
I'm a bit of a B.C. politics junkie (if you are too, I highly recommend CHNL's "Inside Politics" podcast). And since the 2017 election, there's been a lot of talk about the province's "urban/rural divide". Specifically, how few seats the NDP got outside of Metro Vancouver and Vancouver Island.
There's also been some talk lately about electoral reform, as the new NDP/Green government is planning a referendum on proportional representation next fall.
Which, weirdly, got me thinking of the 1993 Canadian federal election. That's the one where the separatist Bloc Quebecois became the Official Opposition with 54 seats and Kim Campbell's Progressive Conservatives government was completely humiliated, winning only 2 (!) seats.
But the really weird thing about the 1993 election was that the Progressive Conservatives actually got more votes (2.2 million) than the BQ (1.8 million) did.
But because the BQ's votes were geographically concentrated in Quebec, while the PC's were scattered across the country, the BQ got way more seats. The way Canada voted rewarded a party with regional, rather than national, ambitions.
I wondered if something similar might have happened in B.C.: Whether the way we elect MLAs might make our regional divisions seem more severe than they really are.
So I did a bit of number crunching using Elections BC data and map files.
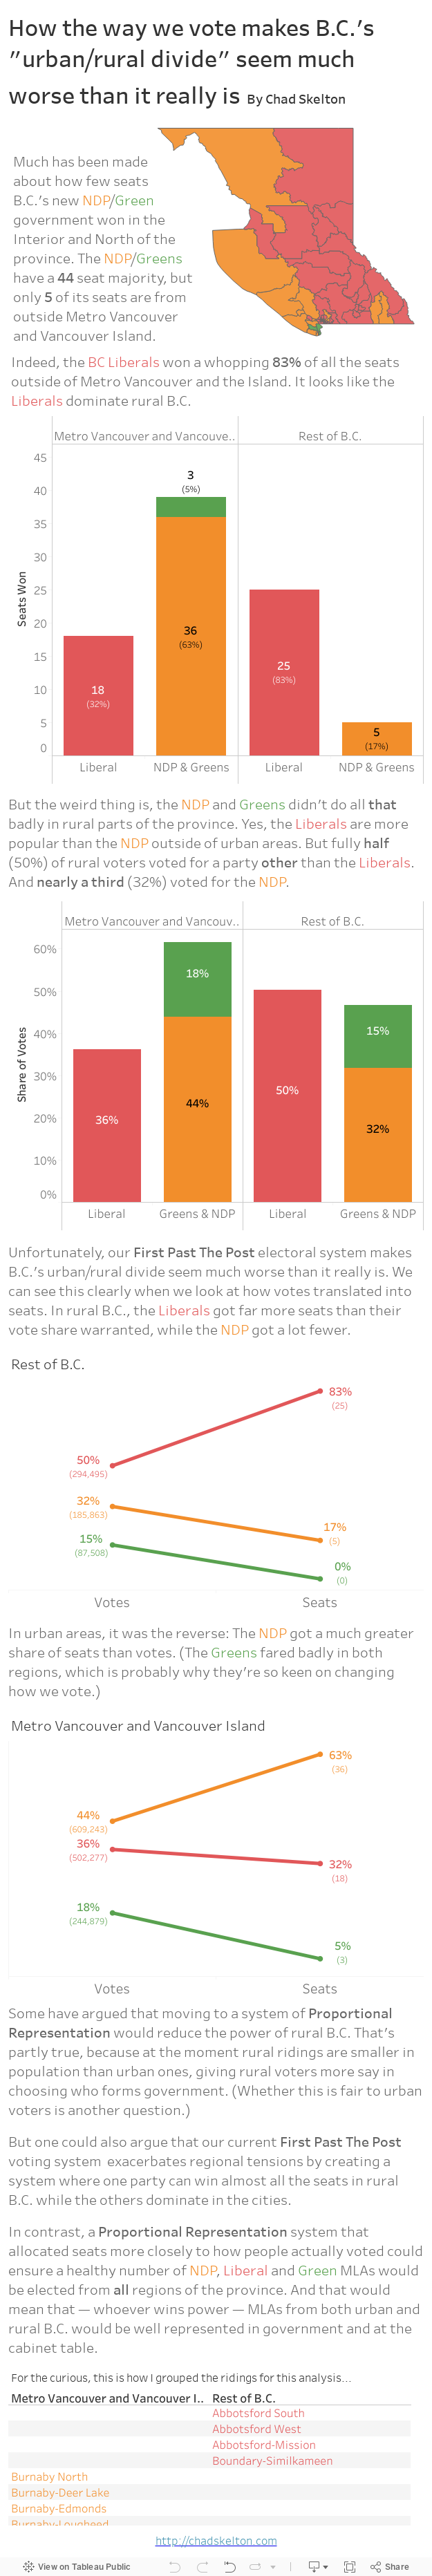
The situation isn't anywhere near as severe as the 1993 election, but the First Past The Post electoral system does definitely exaggerate the BC Liberals' popularity in rural B.C. (and, to a lesser extent, the NDP's popularity in urban areas).
The biggest decision I had to make was where to draw the boundaries for the purpose of my analysis. I've seen some pundits refer to how the NDP didn't get many seats outside the "Lower Mainland" and "Southern Vancouver Island". But those are slightly fuzzy concepts. Where does one divide Vancouver Island between north and south? And while many people think of the Lower Mainland as the same thing as Metro Vancouver, it's not.
So, instead, I decided to lump Metro Vancouver (a well-defined regional district) together with all of Vancouver Island. That seemed to fit the electoral patterns of the province best. After all, the NDP is pretty popular up and down the Island and the Liberals are still pretty strong in Fraser Valley communities like Abbotsford and Chilliwack.
If you don't agree with my choices, though, you're more than welcome to download the Tableau workbook yourself and choose different regions.
Thank you for a simple, honest and clear illustration of the political realities in BC and federal elections. There's so much misinformation being spread around and people just need to look at basic numbers with an explanation to see why change is so imperative in our electoral system.
ReplyDeleteexcellent analogy Chad. There is a tsunami of misinformation out there and it will only get worse as time gets closer to the referendum. Your comparison is stark proof that PR is superior to FPTP. I'll be posting this post on our FVC/Victoria Facebook page. Great to have another tool in our toolbox.
ReplyDeleteExcellent illustration Chad. Thank you. I will post this on my own page and on that of my local BC NDP riding (Vancouver-Langara). Good stuff.
ReplyDelete"Some have argued that moving to a system of Proportional Representation would reduce the power of rural B.C. That's partly true, because at the moment rural ridings are smaller in population than urban ones, giving rural voters more say in choosing who forms government. (Whether this is fair to urban voters is another question.)"
ReplyDeleteJust FYI, there are plenty of PR models where the number of seats in each region stay the same. Just take a look at the 2009 BCSTV map for one example. Please don't give credence to those who assume PR will reduce the number of rural seats.